On Relating Visual Elements to City Statistics
Sean M. Arietta, Maneesh Agrawala, Ravi Ramamoorthi
Abstract
We investigate the relationship between visual elements and statistical quantities in cities. Although certain city statistics like the presence of trees and graffiti have a natural connection to visual elements, more abstract statistical quantities such as crime rates and housing prices relate to visual content in a less intuitive way. We show that there is a strong connection between visual elements and these statistics and that this relationship is general enough to predict these statistics in new cities. Given a set of street-level images and geo-located samples of a statistic we first identify visual elements in the images that are discriminative of the statistic (e.g. our system determined that rounded windows and doors in Boston are visually discriminative of affluence). We then build a predictor by learning a weight for each of these elements using a robust regression technique. To perform these operations efficiently, we implemented a scalable distributed processing framework that can process a single statistic (10,000 images) 4x faster than previous methods. We tested the performance of our computed predictors on the statistics: theft, affluence, graffiti presence, and tree presence. We found that at least one predictor for every statistic could interpolate that statistic with 67%-81% accuracy. In addition, we found that we can predict statistics in new cities with up to 76% accuracy. We also tested human performance for predicting theft based on images and found that our method outperformed this baseline with 39% higher accuracy. We present two prototype applications that use our predictors to provide estimates of city statistics: a statistic-sensitive wayfinding program capable of routing travelers through or around statistics of interest (e.g. routing a tourist around a high theft area), and a user-assisted tool for automatically finding graffiti in street-level images.
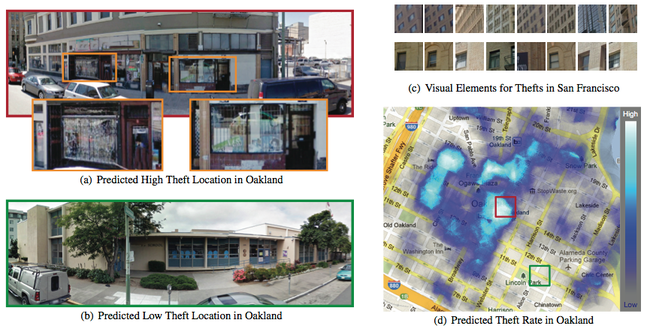
Our system automatically computes a predictor from a set of Google StreetView images of areas where a statistic was observed. In this example we use a predictor generated from reports of theft in San Francisco to predict the probability of thefts occurring in Oakland. Our system can predict high theft rate areas (a) and low theft rates area (b) based solely on street-level images from the areas. Visually, the high theft area exhibits a marked quality of disrepair (bars on the windows, unkempt facades, etc), a visual cue that the probability of theft is likely higher. Our method automatically computes machine learning models that detect visual elements similar to these cues (c) from San Francisco. To compute predictions, we use the models to detect the presence of these visual elements in an image and combine all of the detections according to an automatically learned set of weights. Our resulting predictions are 63% accurate in this case and can be computed everywhere in Oakland (d) as they only rely on images as input.