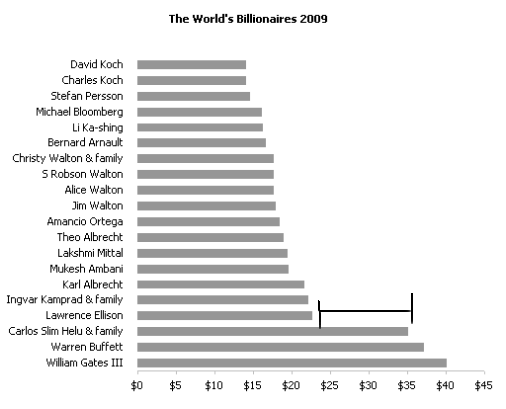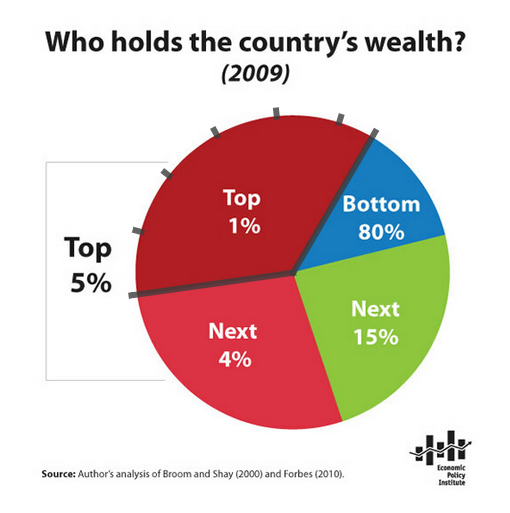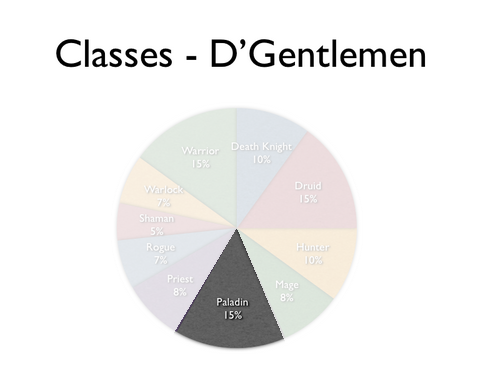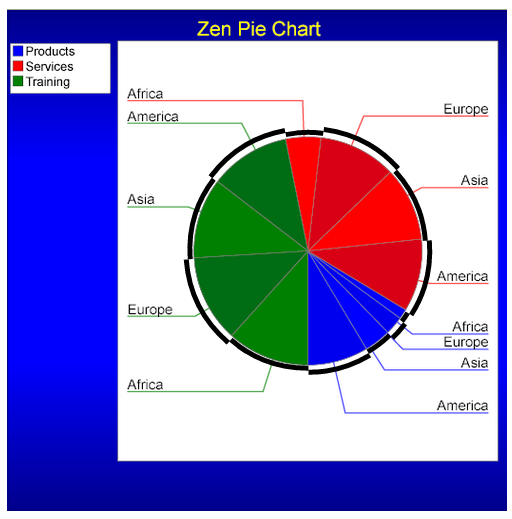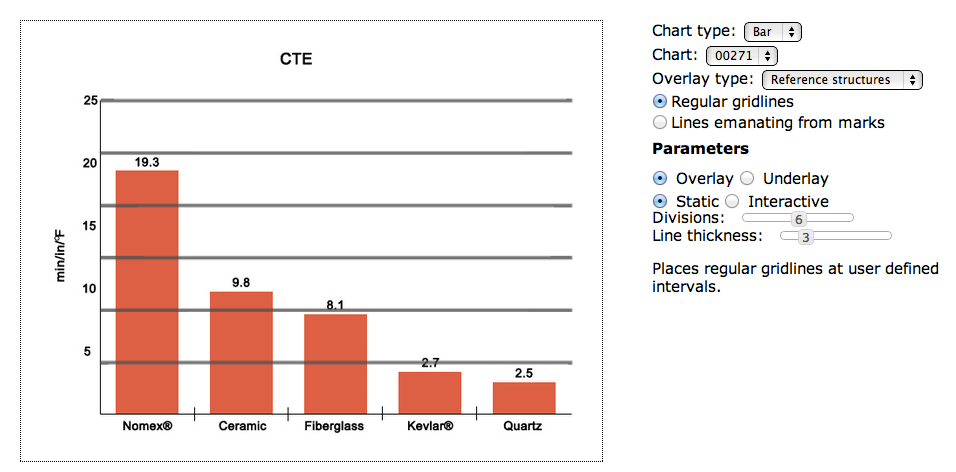

Chart type:
Chart:
Overlay type:
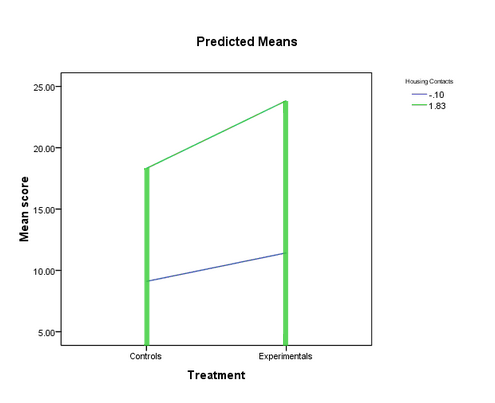
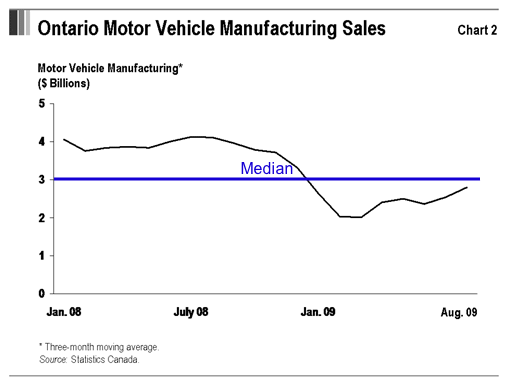
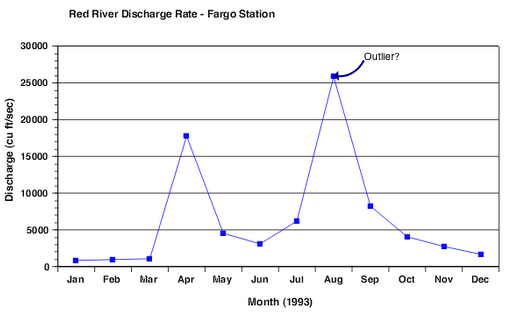
This gallery contains examples of graphical overlays, described in our paper. We have extracted marks and data from the charts using ReVision (for bars and pie charts) and Datathief (for line charts), but all of the overlays are generated in-browser. Try out some of the parameters, or click on an image thumbnail below the gallery to view some example overlays.