Graphical Overlays: Using Layered Elements to Aid Chart Reading
Nicholas Kong, Maneesh Agrawala
Abstract
Reading a visualization can involve a number of tasks such as extracting, comparing or aggregating numerical values. Yet, most of the charts that are published in newspapers, reports, books, and on the Web only support a subset of these tasks. In this paper we introduce graphical overlays—visual elements that are layered onto charts to facilitate a larger set of chart reading tasks. These overlays directly support the lower-level perceptual and cognitive processes that viewers must perform to read a chart. We identify five main types of overlays that support these processes; the overlays can provide (1) reference structures such as gridlines, (2) highlights such as outlines around important marks, (3) redundant encodings such as numerical data labels, (4) summary statistics such as the mean or max and (5) annotations such as descriptive text for context. We then present an automated system that applies user-chosen graphical overlays to existing chart bitmaps. Our approach is based on the insight that generating most of these graphical overlays only requires knowing the properties of the visual marks and axes that encode the data, but does not require access to the underlying data values. Thus, our system analyzes the chart bitmap to extract only the properties necessary to generate the desired overlay. We also discuss techniques for generating interactive overlays that provide additional controls to viewers. We demonstrate several examples of each overlay type for bar, pie and line charts.
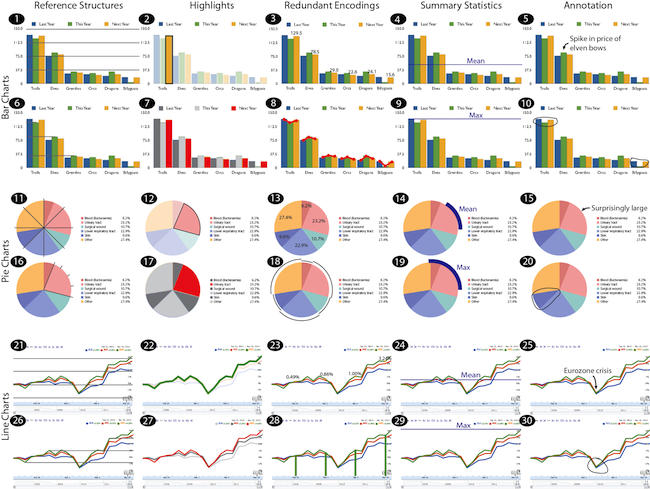
Examples of visual overlays organized by type. These overlays were manually generated to illustrate the different overlay types.