City Forensics: Using Visual Elements to Predict Non-Visual City Attributes
Sean Arietta, Alexei A. Efros, Ravi Ramamoorthi, Maneesh Agrawala
Abstract
We present a method for automatically identifying and validating predictive relationships between the visual appearance of a city and its non-visual attributes (e.g. crime statistics, housing prices, population density etc.). Given a set of street-level images and (location, city-attribute-value) pairs of measurements, we first identify visual elements in the images that are discriminative of the attribute. We then train a predictor by learning a set of weights over these elements using non-linear Support Vector Regression. To perform these operations efficiently, we implement a scalable distributed processing framework that speeds up the main computational bottleneck (extracting visual elements) by an order of magnitude. This speedup allows us to investigate a variety of city attributes across 6 different American cities. We find that indeed there is a predictive relationship between visual elements and a number of city attributes including violent crime rates, theft rates, housing prices, population density, tree presence, graffiti presence, and the perception of danger. We also test human performance for predicting theft based on street-level images and show that our predictor outperforms this baseline with 33% higher accuracy on average. Finally, we present three prototype applications that use our system to (1) define the visual boundary of city neighborhoods, (2) generate walking directions that avoid or seek out exposure to city attributes, and (3) validate user-specified visual elements for prediction.
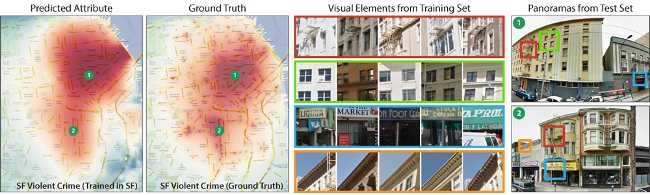
The violent crime rate in San Francisco is an example of a non-visual city attribute that is likely to have a strong relationship to visual appearance. Our method automatically computes a predictor that models this relationship, allowing us to predict violent crime rates from streetlevel images of the city. Across the city our predictor achieves 73% accuracy compared to ground truth. (columns 1 and 2, heatmaps run from red indicating a high violent crime rate to blue indicating a low violent crime rate). Specifically, our predictor models the relationship between visual elements (column 3), including fire escapes on fronts of buildings, high-density apartment windows, dilapidated convenience store signs, and unique roof style, relate to increased violent crime rates. Our predictor also identifies street-level images from San Francisco that have an unsafe visual appearance (column 4). Detections of visual elements are outlined in color.