Deconstructing and Restyling D3 Visualizations
Jonathan Harper, Maneesh Agrawala
Abstract
The D3 JavaScript library has become a ubiquitous tool for developing visualizations on the Web. Yet, once a D3 visualization is published online its visual style is difficult to change. We present a pair of tools for deconstructing and restyling existing D3 visualizations. Our deconstruction tool analyzes a D3 visualization to extract the data, the marks and the mappings between them. Our restyling tool lets users modify the visual attributes of the marks as well as the mappings from the data to these attributes. Together our tools allow users to easily modify D3 visualizations without examining the underlying code and we show how they can be used to deconstruct and restyle a variety of D3 visualizations.
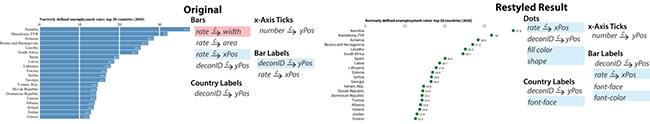
The mappings from a bar chart built using D3 before (left column) and after (right column) deconstruction and restyling with our tools. Deconstructed mappings are shown to the right of the original visualization, and the mappings after restyling are shown to the right of the restyled result along with any unmapped attributes that were changed in the restyling. We use the arrow notation to indicate linear and categorical mappings. Mappings removed and added during restyling are highlighted in red and and green respectively. Changed mappings and attributes are highlighted in blue.
The original bar chart shows the 20 countries with the highest unemployment rates sorted by unemployment rate along the y-axis. We restyle the chart into a dot plot. Original visualization by Leon du Toit (http://bl.ocks.org/leondutoit/6436923/).
Research Paper
Additional Materials
D3 Deconstructor Chrome extension with source code