Multi-Scale Banking to 45 Degrees
Jeffrey Heer, Maneesh Agrawala
Abstract
In his text Visualizing Data, William Cleveland demonstrates how the aspect ratio of a line chart can affect an analyst's perception of trends in the data. Cleveland proposes an optimization technique for computing the aspect ratio such that the average absolute orientation of line segments in the chart is equal to 45 degrees. This technique, called banking to 45 degrees, is designed to maximize the discriminability of the orientations of the line segments in the chart. In this paper, we revisit this classic result and describe two new extensions. First, we propose alternate optimization criteria designed to further improve the visual perception of line segment orientations. Second, we develop multi-scale banking, a technique that combines spectral analysis with banking to 45 degrees. Our technique automatically identifies trends at various frequency scales and then generates a banked chart for each of these scales. We demonstrate the utility of our techniques in a range of visualization tools and analysis examples.

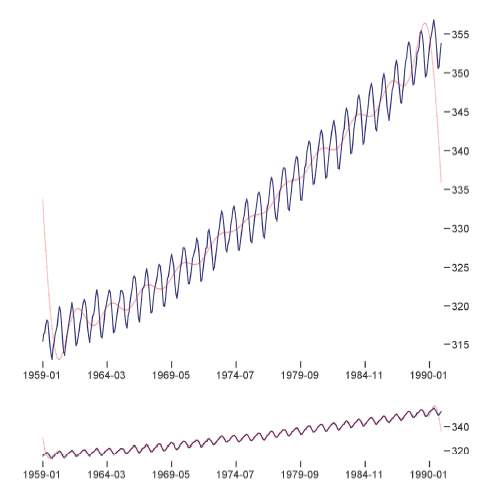
Two plots of monthly atmospheric carbon dioxide measurements, taken from 1959 to 1990. The first plot, with an aspect ratio of 1.17, reveals an accelerating increase in CO2 levels. The second plot, with an aspect ratio of 7.87, facilitates closer inspection of seasonal fluctuations, revealing a gradual attack followed by a steeper decay. These aspect ratios were automatically determined using multi-scale banking.