Perceptual Interpretation of Ink Annotations on Line Charts
Nicholas Kong, Maneesh Agrawala
Abstract
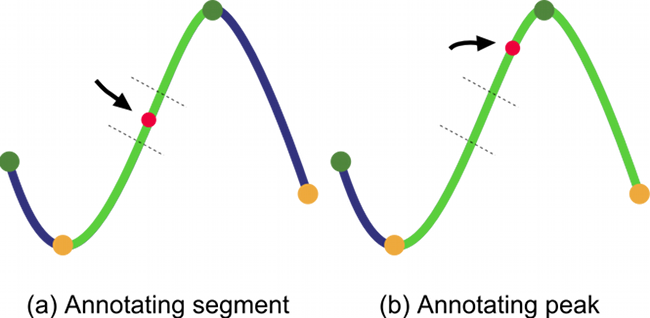
Asynchronous collaborators often use freeform ink annotations to point to visually salient perceptual features of line charts such as peaks or humps, valleys, rising slopes and declining slopes. We present a set of techniques for interpreting such annotations to algorithmically identify the corresponding perceptual parts. Our approach is to first apply a parts-based segmentation algorithm that identifies the visually salient perceptual parts in the chart. Our system then analyzes the freeform annotations to infer the corresponding peaks, valleys or sloping segments. Once the system has identified the perceptual parts it can highlight them to draw further attention and reduce ambiguity of interpretation in asynchronous collaborative discussions.
